


When monitoring application performance, many dashboards display the average response time. While this seems useful, averages can be misleading because they often hide slow requests that negatively impact real users.
Why Average Response Time Isn't Enough
Imagine your application processes 100 requests:
- 99 requests complete in 20 ms
- 1 request takes 5,000 ms
The average response time is only 69.8 ms, which appears healthy. However, one user still waited 5 seconds, resulting in a poor experience.
This is why relying only on averages can make performance issues difficult to detect.
What Are Latency Percentiles?
Latency percentiles show how response times are distributed across all requests.
- p50 (Median): 50% of requests are faster than this value. Represents the typical user experience.
- p90: 90% of requests complete within this time. The slowest 10% take longer.
- p95: 95% of requests complete within this time. Commonly used for SLAs and performance monitoring.
- p99: 99% of requests complete within this time. Highlights the slowest 1% of requests.
- p99.9: Used in large-scale, latency-sensitive systems where even rare slow requests matter.
For example, if your service handles 1 million requests per day, a p99 latency represents the experience of the slowest 10,000 requests far from insignificant.
Why p95 and p99 Are Important
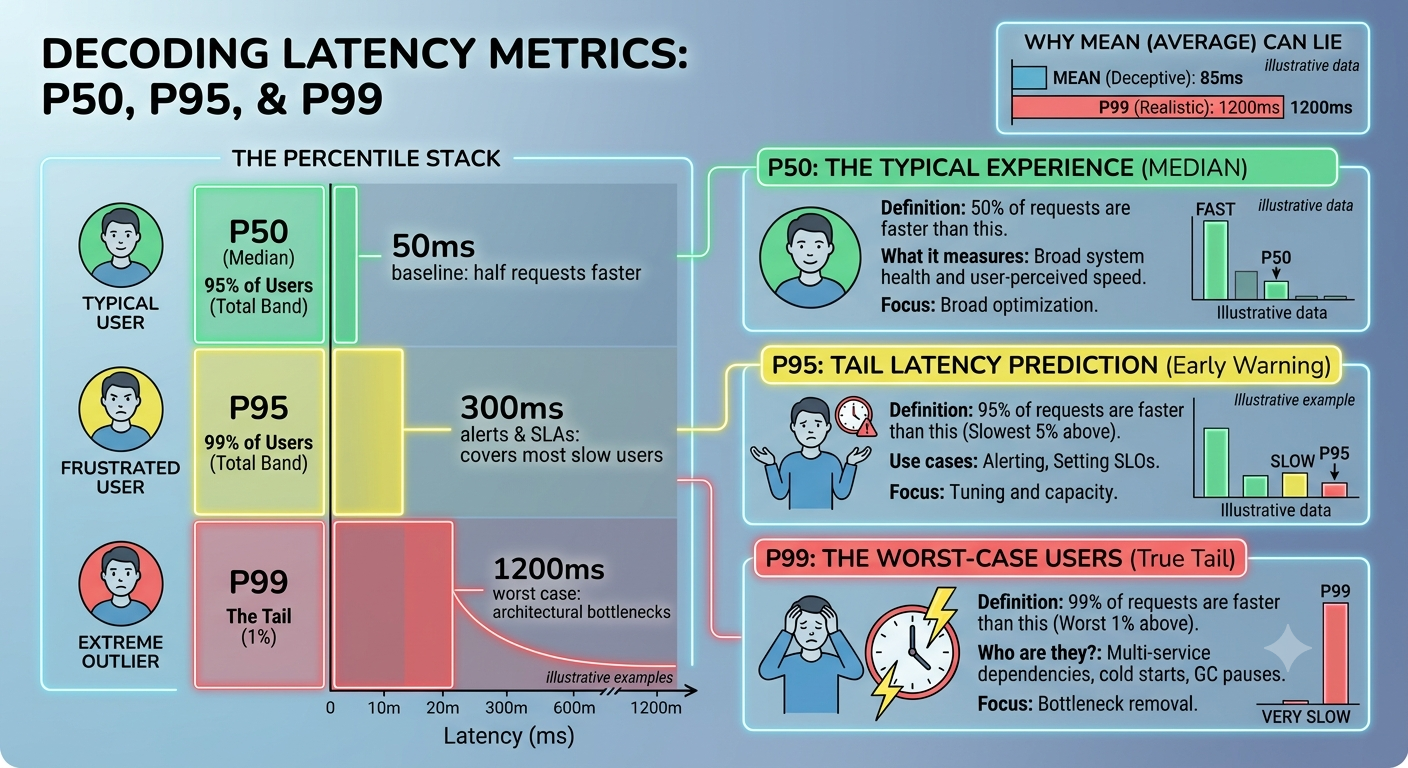
Users remember slow experiences more than fast ones. Even if most requests are quick, a small percentage of slow responses can significantly affect user satisfaction.
In distributed systems, a single user request often depends on multiple services such as databases, caches, authentication services, and third-party APIs. Small delays in each service can combine, increasing overall response time a phenomenon known as tail latency amplification.
This is why most Service Level Objectives (SLOs) and Service Level Agreements (SLAs) are defined using p95 or p99, rather than averages.
Choosing the Right Percentile
| Percentile | Best Used For |
|---|---|
| p50 | Typical application performance |
| p90 | Internal dashboards and alerting |
| p95 | Standard SLA/SLO monitoring |
| p99 | High-scale, latency-sensitive applications |
| p99.9+ | Critical systems like finance, telecom, and real-time services |
The right percentile depends on your application's scale and how costly slow requests are to your users.
Common Mistakes
When working with latency percentiles, avoid these common pitfalls:
- Don't average percentiles across servers. Percentiles must be calculated from aggregated data.
- Small datasets produce unreliable high percentiles. A p99 calculated from only 100 requests isn't statistically meaningful.
- Percentiles show that requests are slow, not why. Combine them with distributed tracing to identify root causes.
- Choose an appropriate time window. Short windows (1–5 minutes) are better for alerting, while longer windows help identify trends.
Measuring Percentiles
Modern observability platforms provide built-in percentile metrics:
- Prometheus using Histograms and
histogram_quantile() - Grafana
- Datadog
- New Relic
A typical latency dashboard might look like this:
p50   : 45 ms
p90   : 120 ms
p95   : 210 ms
p99   : 850 ms
p99.9 : 4200 ms
A healthy system usually has a gradual increase across percentiles. A sharp jump between p95 and p99 often indicates tail latency problems that need investigation.
Key Takeaways
- Average response time can hide performance problems.
- Percentiles provide a much clearer picture of real user experience.
- p95 and p99 are the most valuable metrics for monitoring application performance.
- Tail latency becomes increasingly important in distributed systems.
- Combine percentile metrics with tracing and logging to quickly identify performance bottlenecks.
Monitoring percentiles instead of averages helps engineering teams detect issues earlier, build more reliable systems, and deliver a consistently better experience for users.